Data Report with Charts
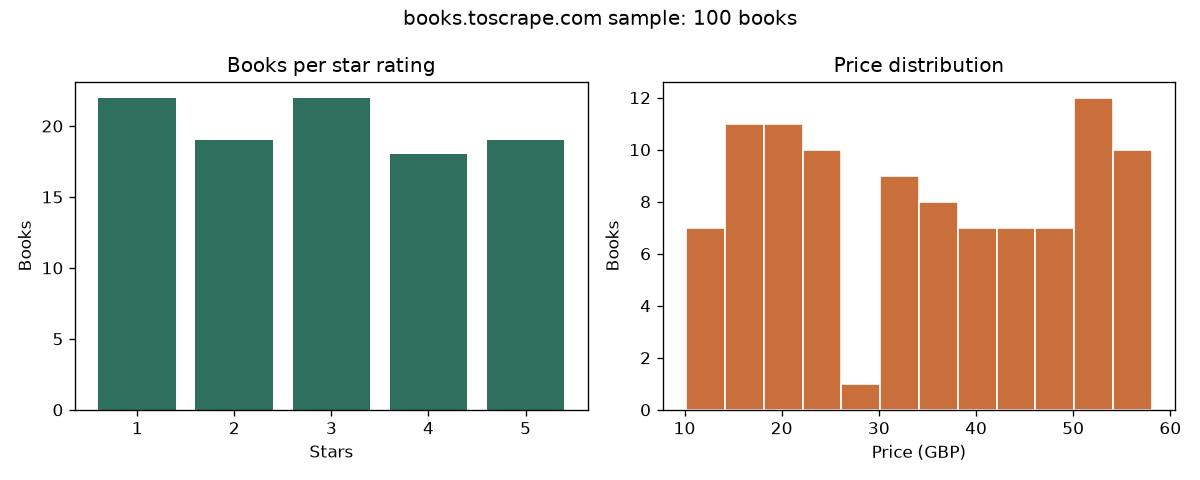
PythonReportingTurns the scraper's CSV into a one-page HTML report: summary stats, a table and two charts.
Run it
cd samples/data-report
python make_report.py   # needs pandas, matplotlib; run the scraper first
Files: report.html · chart.png · make_report.py
Code
"""Build a small HTML report + charts from the scraper output (../book-scraper/books.csv)."""
import pandas as pd, matplotlib
matplotlib.use("Agg"); import matplotlib.pyplot as plt

df = pd.read_csv("../book-scraper/books.csv")
by = df.groupby("rating")["price_gbp"].agg(["count", "mean", "min", "max"]).round(2)
fig, ax = plt.subplots(1, 2, figsize=(10, 4))
ax[0].bar(by.index.astype(str), by["count"], color="#2f6f5e"); ax[0].set(title="Books per star rating", xlabel="Stars", ylabel="Books")
ax[1].hist(df["price_gbp"], bins=12, color="#c96f3b", edgecolor="white"); ax[1].set(title="Price distribution", xlabel="Price (GBP)", ylabel="Books")
fig.suptitle(f"books.toscrape.com sample: {len(df)} books"); fig.tight_layout(); fig.savefig("chart.png", dpi=120)
html = f"""<!doctype html><meta charset=utf-8><title>Book price report</title>
<style>body{{font-family:system-ui;max-width:860px;margin:2rem auto;padding:0 1rem;color:#222}}table{{border-collapse:collapse}}td,th{{border:1px solid #ccc;padding:.3rem .7rem;text-align:right}}img{{max-width:100%}}</style>
<h1>Book price report</h1><p>Source: {len(df)} listings scraped from books.toscrape.com (a practice site; prices are fictional).</p>
<p>Mean price: £{df.price_gbp.mean():.2f} · Median: £{df.price_gbp.median():.2f} · In stock: {df.in_stock.mean():.0%}</p>
<img src="chart.png" alt="charts"><h2>Price by rating</h2>{by.to_html()}
<p>Correlation between rating and price: {df.rating.corr(df.price_gbp):.2f} (near zero = no meaningful relationship in this sample).</p>"""
open("report.html", "w").write(html); print("wrote chart.png and report.html"); print(by)